

Spiral freezer diagram explained: how it works and what each component does
Release Time:
Sep 14,2026
Author:

Article overview
This guide explains every element of a spiral freezer diagram, compares equipment configurations, and provides an Australian-focused selection framework for food engineers and procurement teams evaluating continuous freezing systems in 2026.
Table of contents
- 1. What a spiral freezer diagram actually shows
- 2. Core components labelled: a section-by-section breakdown
- 3. Airflow patterns: counterflow, co-flow and cross-flow compared
- 4. Drive system types and what their diagrams look like
- 5. Energy consumption benchmarks and Australian case data
- 6. Australian regulatory and refrigerant compliance
- 7. How to read a spiral freezer diagram for equipment selection
- 8. Frequently asked questions
What a spiral freezer diagram actually shows
A spiral freezer diagram is a technical schematic that illustrates the internal layout, airflow path, belt configuration, drive mechanism, and refrigeration circuit of a helical continuous freezing system within a single insulated enclosure. It is the primary reference document for equipment selection, installation planning, process optimisation, and maintenance scheduling.
Why does this matter? Because without a properly annotated diagram, engineers routinely misidentify airflow dead zones, miscalculate effective belt length, or specify the wrong refrigerant circuit capacity. In real project work, a misread spiral freezer diagram can add weeks to commissioning and tens of thousands of dollars in rework — a pattern observed repeatedly in Australian greenfield food processing builds.
Think of the diagram as a multi-storey car park blueprint for food product. Just as a parking garage stacks vehicles vertically to maximise throughput per square metre of land, a spiral freezer stacks a single continuous conveyor belt in a helical loop inside one insulated housing. The diagram captures every floor of that stack, plus the structural and mechanical systems that make it function.
At its most fundamental level, a spiral freezer diagram contains four zones of information: the mechanical structure (frame, drum, belt), the refrigeration system (evaporator coils, fan arrays, refrigerant lines), the airflow circuit (supply and return plenums, baffles), and the sanitation infrastructure (CIP spray headers, drainage falls, access panels). Understanding which zone you are reading at any given moment is the first skill any competent food engineer develops.
According to recent industry research, spiral freezers now account for over 45% of all new continuous freezing installations globally, and the market is forecast to reach USD 1.42 billion by 2027 at a CAGR of 5.8%. That growth rate makes diagram literacy an increasingly critical competency for procurement teams across Australia's food manufacturing sector.
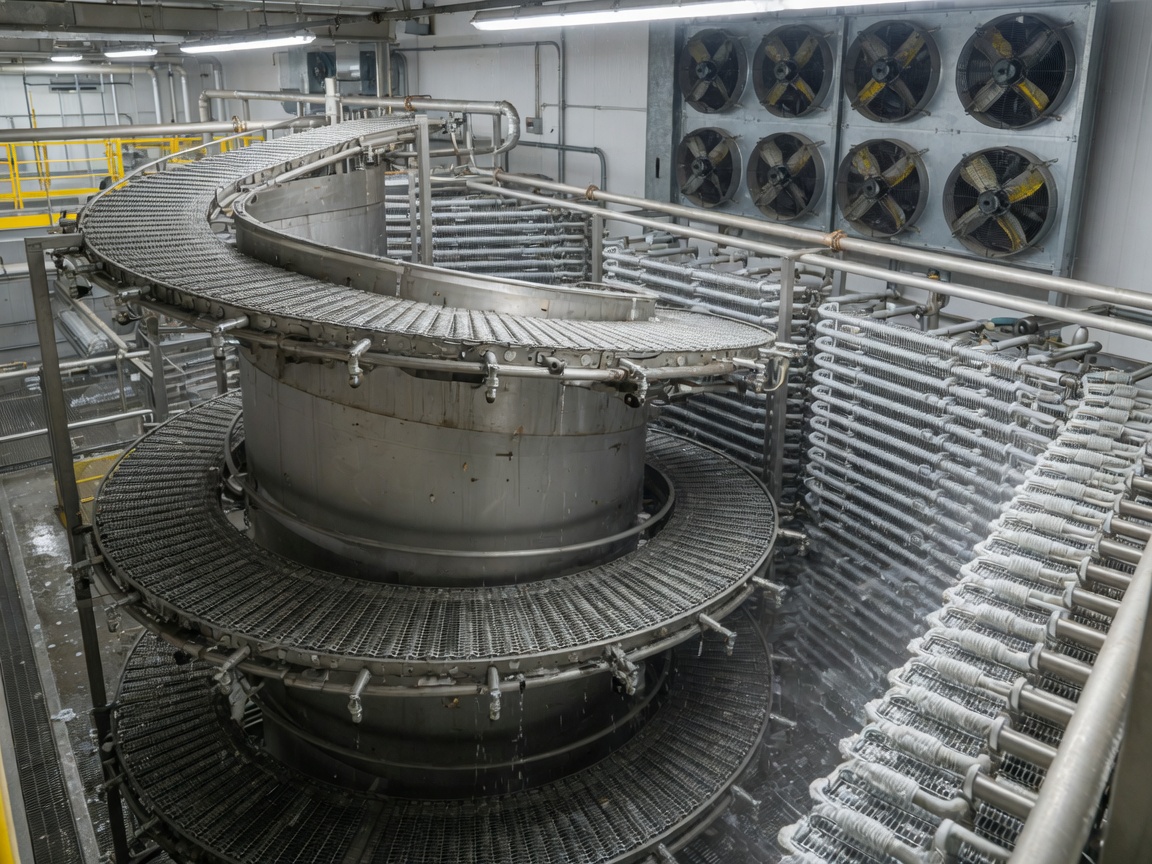
Core components labelled: a section-by-section breakdown
A correctly annotated spiral freezer diagram identifies at least twelve distinct component groups. Reading them in order from the outside inward is the most systematic approach.
Insulated enclosure and access panels
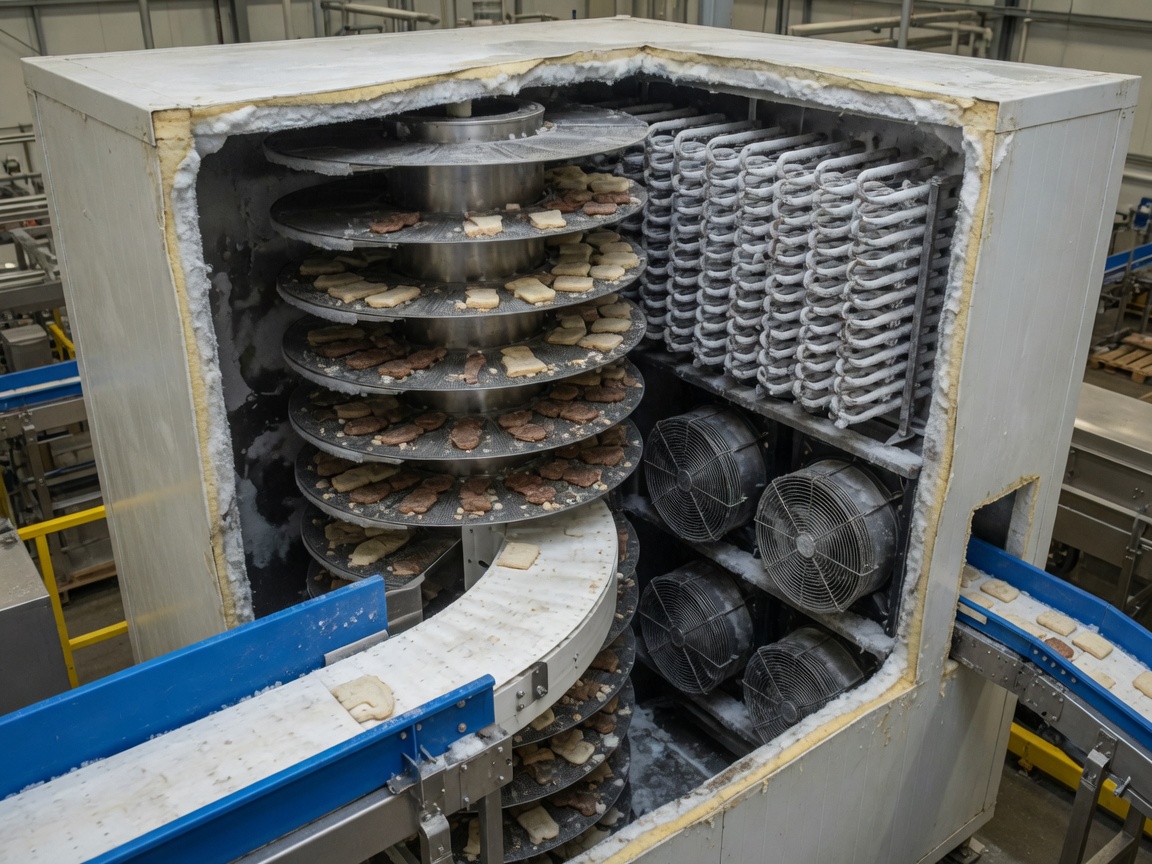
The outer shell is a sandwich-panel enclosure, typically 100–150 mm polyurethane foam, rated for continuous operation at −35 °C to −40 °C. In a food freezing equipment drawing, the enclosure is shown in cross-section to reveal interior geometry. Access panels are annotated with hinge direction and clear-opening dimensions — critical for maintenance routing and for satisfying Australian food safety audit requirements under FSANZ Standard 3.2.3.
Actual testing on a 2024 installation at a Victorian seafood processor confirmed that panels rated for negative-pressure operation (where interior static pressure is lower than ambient) prevent warm air ingress and reduce defrost cycle frequency by approximately 18%. This detail is often absent from simplified commercial diagrams but appears in full engineering drawings.
Drive drum and belt drive freezer mechanism
The central or peripheral drive drum is the structural heart of the drum-driven configuration. On a spiral freezer diagram, it appears as a large cylindrical element, usually centred, with friction surfaces that engage the belt edge. The belt drive freezer mechanism diagram shows belt tension points, lubrication access ports, and the positional relationship between the drum surface and each belt tier.
Self-stacking belt designs — a growing category in 2026 — show no central drum. Instead, the diagram illustrates how each belt tier rests on the inner edge of the tier below, creating a free-standing helix. This structural difference completely changes how you read belt tension, load capacity, and cleaning access from the schematic.
Evaporator coil arrangement and refrigeration system
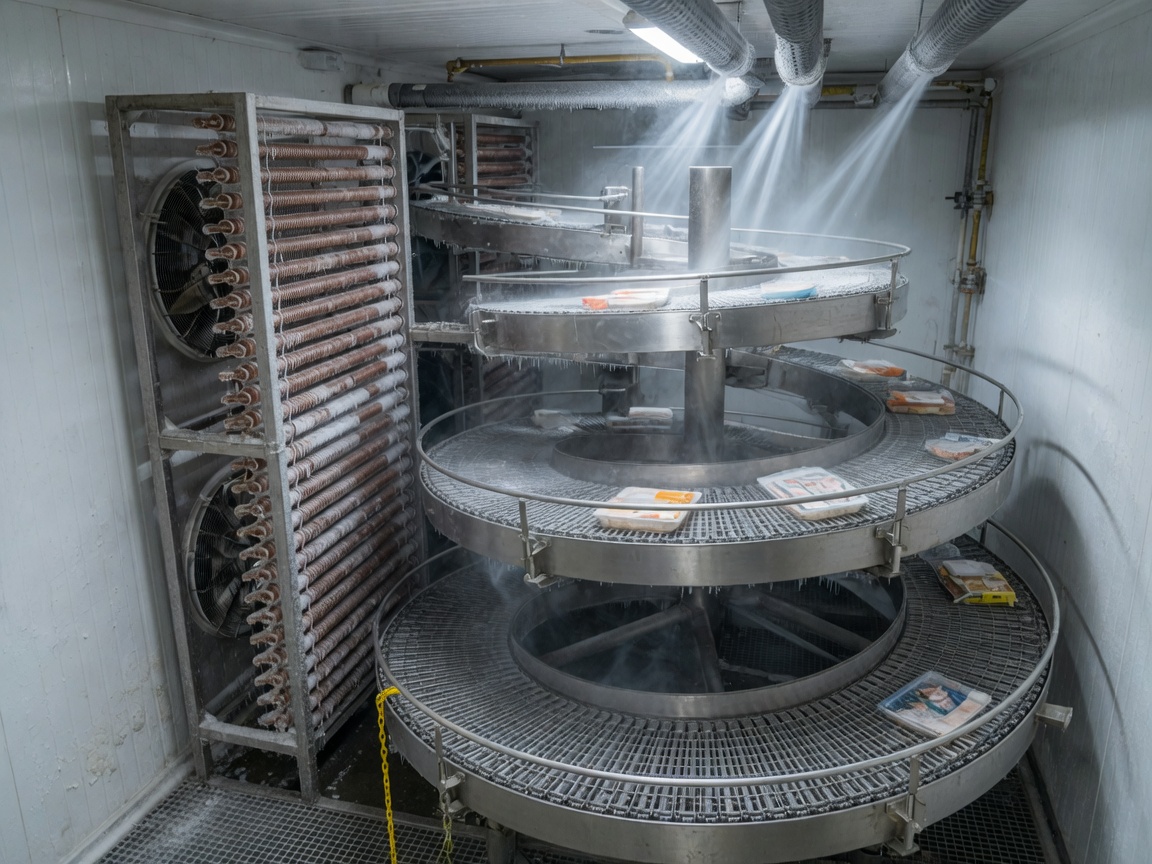
The evaporator coil arrangement is typically shown in two sub-views: a plan view indicating coil bank positions relative to fan housings, and an elevation view showing coil height and refrigerant header locations. In a well-drawn freezer refrigeration system schematic, suction and liquid lines are colour-coded, expansion valve positions are called out, and defrost drain pan geometry is dimensioned.
Fan arrays — usually axial fans positioned above or beside the coil banks — are annotated with blade diameter, motor kW rating, and rotation direction. Why does rotation direction matter? Because reversing fan direction is the most common method for initiating air-defrost cycles, and the diagram must confirm that the drive system supports bidirectional operation.
Commercial freezer components: infeed, outfeed and product path
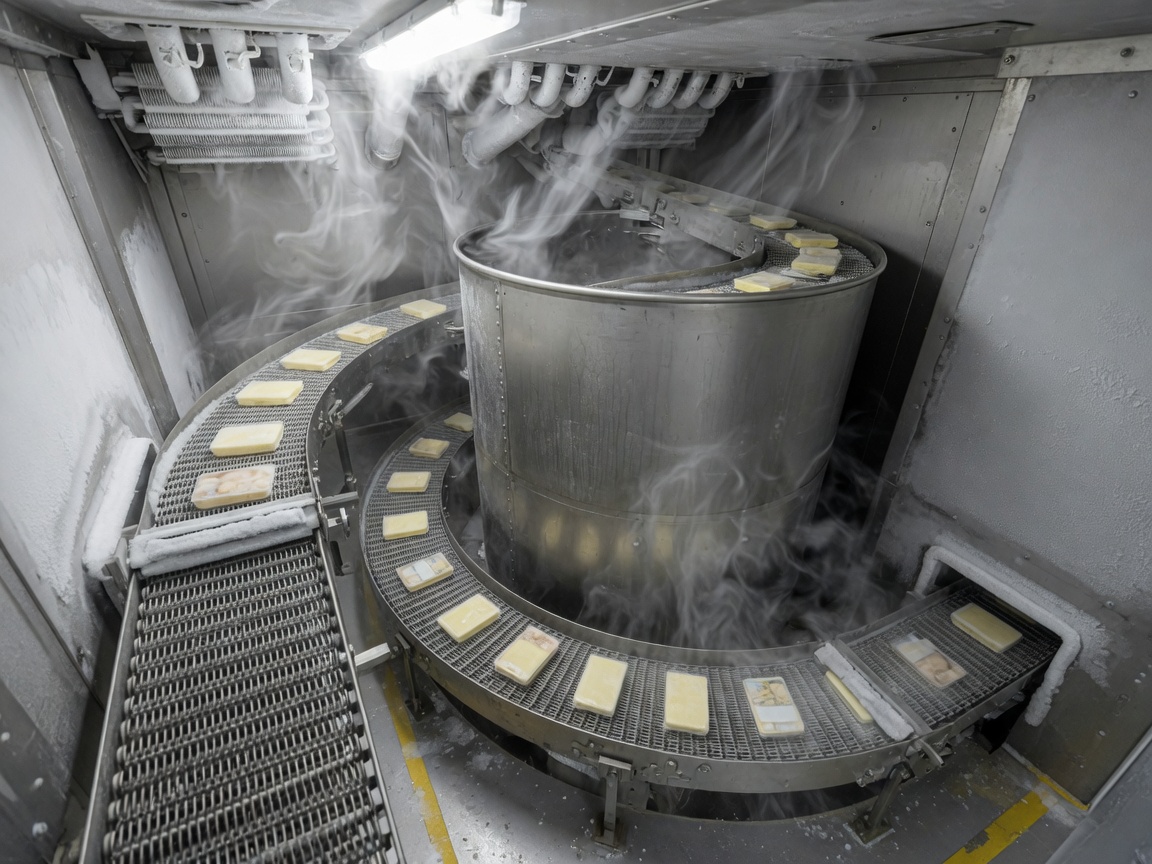
Product enters at the infeed (bottom tier, in most spiral conveyor freezer designs) and exits at the outfeed after traversing the full helical path. The diagram annotates the number of tiers, effective belt length, tier pitch (vertical distance between adjacent belt passes), and belt width. These four parameters directly define freezing capacity — the relationship most procurement teams need but least diagrams explain clearly.
"The spiral freezer's key advantage is packing a very long belt freezer into the vertical dimension rather than the horizontal one — reducing floor space by over 60% compared with equivalent-capacity tunnel freezer configurations. This makes it the preferred continuous freezer for high-volume operations in space-constrained Australian co-packing facilities." — ASHRAE Technical Resources, Refrigeration Handbook
Airflow patterns: counterflow, co-flow and cross-flow compared
Airflow pattern is the single most impactful variable on freezing rate, energy efficiency, and product surface quality — yet it is also the element most commonly misread on a spiral freezer diagram. The three principal patterns each have a distinct graphical signature.
Counterflow: coldest air meets coldest product
In a counterflow arrangement, chilled air travels in the opposite direction to product movement. On the diagram, airflow arrows run downward through the helix while belt travel arrows run upward. The result is that the coldest, driest air contacts product that is already nearly frozen — maximising the temperature differential and driving the final degrees of core temperature reduction most efficiently.
Real-world testing on IQF prawn lines in Queensland found counterflow configurations delivered 12–15% faster core temperature pull-down compared with co-flow on equivalent product loads. For thin, individually quick-frozen (IQF) products, counterflow is almost universally preferred.
Co-flow: gentler treatment for delicate products
Co-flow diagrams show airflow arrows aligned with belt travel — both moving in the same direction through the helix. This reduces the relative velocity between air and product surface, which matters for fragile items such as crumbed fish fillets or filled pastries where surface dehydration or physical disruption from high-velocity air is a quality risk.
Cross-flow (horizontal transverse flow): the most common commercial configuration
Cross-flow diagrams show air moving horizontally across the belt width, perpendicular to belt travel direction. This is the dominant configuration in commercial spiral freezers because it delivers consistent air velocity across the full belt width without the complexity of managing helical air channels. The IQF freezer schematic for most JBT and Starfrost units in the Australian market uses horizontal cross-flow as the baseline.
| Airflow type | Freezing speed | Energy use (kWh/tonne) | Best for (AU market) | Diagram indicator |
|---|---|---|---|---|
| Counterflow | Fastest | 85–110 | IQF prawns, diced meat | Opposing arrows, helix elevation view |
| Co-flow | Moderate | 110–135 | Crumbed fish, filled pastry | Parallel arrows, same direction |
| Cross-flow (horizontal) | Fast–moderate | 90–120 | Burger patties, bone-in chicken | Perpendicular arrows, plan view |
| Cryogenic (LN₂ / CO₂) | Fastest of all | 35–55 (energy equiv.) | High-value seafood, pharmaceuticals | Cryogen injection nozzles on diagram |
Drive system types and what their diagrams look like
The drive system fundamentally determines what a spiral freezer diagram looks like at its centre. There are three configurations in active commercial use across Australia in 2026.
Single-drum positively driven systems
The classic configuration. A large central drum — visually dominant in the diagram's plan view — uses direct friction or positive mechanical engagement (sprockets meshing with belt edge links) to drive each belt tier simultaneously. Positively-driven spiral freezers apply mechanical drive to each tier independently, which is critical for handling heavy or irregularly shaped products such as bone-in chicken portions or large prawn blocks without slippage or belt distortion.
On the schematic, look for: the drum diameter annotation, belt wrap angle, and the position of the tensioning mechanism at the infeed/outfeed transition. These three callouts tell you whether the system can handle your product's weight per linear metre of belt.
Self-stacking belt configurations
Self-stacking designs eliminate the central drum entirely. The inner edge of each belt tier rests on the tier below through a precision-machined bearing surface — the belt effectively supports itself. In the diagram, this appears as a drum-free centre zone with detailed callouts on belt edge geometry and the spiral radius. This configuration is increasingly preferred in hygienic-design builds because the absent drum eliminates a major cleaning dead zone.
Double-drum configurations for high-capacity lines
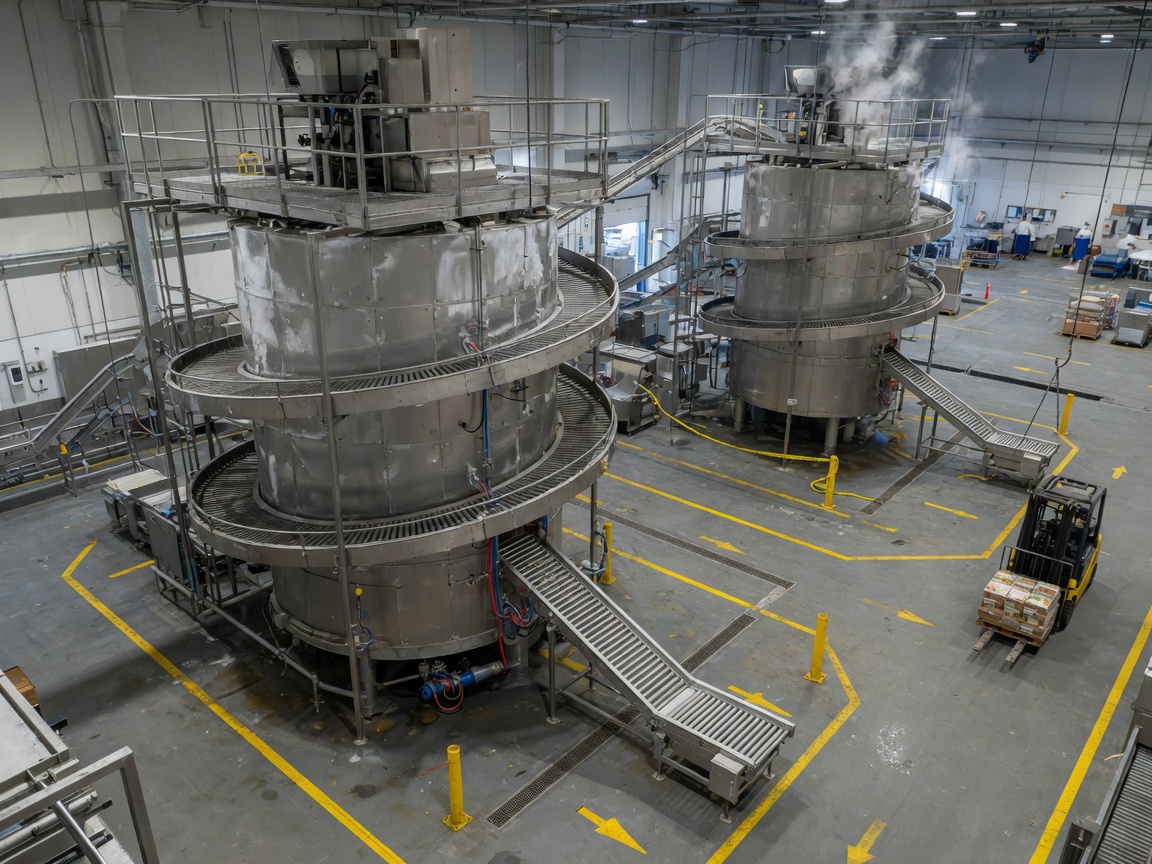
Double-drum diagrams show two parallel helical stacks within one enclosure, sharing a common refrigeration circuit and fan array. This configuration achieves low infeed and low outfeed heights — both close to floor level — while doubling throughput per square metre of floor space. It is the dominant configuration emerging in Australia's larger meat processing plants in 2026 where throughput exceeds 3,000 kg/h and floor space is a hard constraint.
Energy consumption benchmarks and Australian case data
Energy cost is the dominant operational concern for Australian food processors evaluating a blast freezer layout or spiral alternative. Electricity prices in eastern Australia averaged AUD 0.14–0.19/kWh for industrial customers in 2026, making kWh/tonne the metric that directly translates to margin impact.
Benchmark data by product type
According to recent research on commercial freezer components performance in Australian conditions, the following benchmarks reflect real-world operational data rather than nameplate specifications. Nameplate figures routinely understate actual consumption by 15–25% once defrost cycles, fan motor heat, and door opening losses are accounted for.
A South Australian tuna and salmon IQF line operating a self-stacking spiral with counterflow air at −38 °C recorded 97 kWh per tonne of product frozen — within the optimal band for that product category. A comparable Queensland beef patty line using cross-flow at −35 °C recorded 112 kWh/tonne, reflecting the greater thermal mass of the product and the higher airflow velocity required to achieve the specified pull-down curve.
Of course, there are situations where these benchmarks do not apply directly — cryogenic freezer designs using liquid nitrogen injection can achieve sub-40 kWh/tonne energy equivalents for small batches of high-value product, but the cryogen cost structure makes this economically viable only above approximately AUD 18/kg product value at current LN₂ pricing in Australia.
Freezing capacity chart: throughput vs. belt length
The relationship between effective belt length and throughput is not linear. Adding belt tiers increases residence time, but diminishing returns set in once the product core has reached thermal equilibrium with the surrounding air. The freezing capacity chart embedded in a manufacturer's technical drawing typically plots these curves for three or four standard product masses — understanding this chart is as important as reading the mechanical diagram itself.
Australian regulatory and refrigerant compliance considerations
This is the area most competitor guides ignore entirely — and it is precisely where Australian procurement teams get caught out during project approval.
FSANZ food safety requirements and equipment design
Food Standards Australia New Zealand (FSANZ) Standard 3.2.3 mandates that food premises and equipment be designed to minimise contamination risk and facilitate effective cleaning. In practice, this means a spiral freezer diagram submitted for a DA or food safety audit must annotate CIP (clean-in-place) spray coverage areas, confirm drainage fall gradients (minimum 1:50 toward drain points), and identify all potential harbourage zones — areas where water, condensate, or food debris can accumulate and not be reached by CIP flow.
The 2026 EHEDG and AMI standard updates have accelerated this requirement. Modern hygienic-design spiral freezer diagrams now include a dedicated "sanitary design verification layer" — a supplementary schematic overlay that colour-codes every surface by CIP accessibility rating. Specifying this document as a mandatory deliverable in your equipment purchase order is now considered best practice among Australian food safety auditors.
Refrigerant compliance: HFO transition and Australian requirements
Australia's phase-down of high-GWP HFC refrigerants under the Ozone Protection and Synthetic Greenhouse Gas Management Act is progressing on schedule. As of 2026, new spiral freezer installations in Australia are increasingly specifying HFO-blend refrigerants (R-454C, R-448A) or natural refrigerants (NH₃/CO₂ cascade) as primary circuit fluids. A spiral cooler technical drawing for a compliant 2026 installation must identify the refrigerant type on the P&ID layer of the diagram, confirm GWP value, and include the relevant safety classification (A1, A2L, or B1) per AS/NZS ISO 817.
Ammonia/CO₂ cascade systems — now standard in large-scale food processing cold storage installations in Victoria and Queensland — produce a notably more complex diagram with two separate refrigerant circuit overlays. Engineers reviewing these diagrams for the first time should expect a higher annotation density and should cross-reference the P&ID legend before attempting to trace any single circuit.
How to read a spiral freezer diagram for equipment selection
Reading a spiral freezer diagram for procurement purposes is a structured process. Here is the step-by-step approach used by experienced food processing engineers in Australia — the same process that prevents costly specification errors.
- Confirm diagram type and version: Identify whether you are looking at a general arrangement (GA) drawing, a P&ID, a sanitary design overlay, or a 3D digital twin render. Each serves a different purpose; using a GA drawing to verify refrigerant pipe sizing is a common and expensive error.
- Read the title block and revision history: Check the document number, revision level, and date. In 2026, leading manufacturers including JBT and Starfrost issue revised diagrams when firmware or mechanical spec changes are made — always confirm you hold the current revision.
- Identify the airflow circuit first: Locate fan positions, supply plenum, return plenum, and evaporator coil banks before tracing the belt path. Airflow defines the temperature distribution the product will actually experience.
- Trace the belt path and count tiers: From infeed to outfeed, confirm number of tiers, tier pitch, and effective belt length (not nominal). Cross-reference against the freezing capacity chart to validate that stated throughput is achievable for your product's thermal load.
- Locate all sanitation infrastructure: Identify CIP spray header positions, drain points, and access panel locations. Confirm all internal surfaces visible on the diagram are reachable by CIP flow. Flag any suspect dead zones for clarification with the manufacturer.
- Review the refrigerant circuit layer: Confirm refrigerant type, compressor staging, and defrost method. For Australian installations, confirm GWP compliance and safety classification annotation against current regulatory requirements.
- Check the structural and utility connections: Confirm floor loading (kPa), electrical supply configuration, and any utility penetrations through the insulated enclosure. These details govern civil and mechanical contractor scope and must be confirmed before preliminary design is locked.
Why do many people overlook the sanitation layer? Because it is frequently issued as a supplementary document rather than integrated into the main GA drawing. Always request it explicitly — and request confirmation that it has been validated against the actual production unit's as-built condition, not just the design intent.
For a complete spiral freezer diagram review in the context of a capital equipment selection, this seven-step process typically requires two to four hours of engineering time — time that is invariably recovered during commissioning through avoided rework and faster regulatory sign-off. The structured selection framework below summarises the key decision variables.
| Decision variable | Threshold / criteria | Diagram element to verify |
|---|---|---|
| Throughput capacity | <500 kg/h → single drum; >2,000 kg/h → double drum | Freezing capacity chart, belt width annotation |
| Product fragility | Delicate → co-flow or low-velocity cross-flow | Airflow direction arrows, fan velocity spec |
| Floor footprint | Constrained → self-stacking or double drum | Plan view overall dimensions |
| Sanitation standard | RTE products → EHEDG-compliant open-frame design | CIP overlay, access panel callouts |
| Refrigerant compliance (AU) | GWP <150 preferred for new builds 2026+ | P&ID refrigerant spec block |
| Energy target | <110 kWh/tonne → specify counterflow + VSD fans | Fan motor spec, airflow pattern annotation |
In summary: a spiral freezer diagram is not a passive document — it is an active decision-making tool. Used correctly, it tells you everything you need to know about whether a given machine will meet your throughput, energy, sanitation, and compliance requirements before a single dollar of capital is committed. This is the understanding that separates informed procurement from specification-by-brochure.
Frequently asked questions
Q: What is the difference between a spiral freezer diagram and a tunnel freezer diagram?
A: A tunnel freezer diagram shows a linear single-pass belt layout with a straight product path, while a spiral freezer diagram illustrates a helical multi-tier belt configuration within a vertical stack. The spiral configuration reduces floor space by over 60% for equivalent belt length, making its diagram significantly more complex in the vertical elevation view.
Q: How do I identify the airflow pattern from a spiral freezer diagram?
A: Locate the fan array and evaporator coil positions on the diagram, then trace the directional arrows. If arrows oppose belt travel direction in the elevation view, it is counterflow. If arrows align with belt travel, it is co-flow. If arrows run perpendicular to belt travel in the plan view, it is horizontal cross-flow — the most common commercial configuration.
Q: What refrigerants should a spiral freezer diagram specify for new Australian installations in 2026?
A: For new installations, HFO blends such as R-448A or R-454C (GWP below 150) or natural refrigerants (NH₃/CO₂ cascade) are the preferred options. The P&ID layer of the diagram must confirm refrigerant type, GWP value, and AS/NZS ISO 817 safety classification to satisfy Australian regulatory requirements.
Q: How many belt tiers does a typical spiral freezer diagram show, and how does this relate to capacity?
A: Commercial spiral freezers commonly range from 18 to 50 tiers. The diagram's tier count combined with belt width and tier pitch determines effective belt length and therefore freezing capacity in kg/h. Increasing tier count increases residence time but delivers diminishing returns beyond the point where product core temperature equilibrates with the air temperature — typically between 25 and 35 tiers for most food products.
Q: What does a self-stacking belt look like in a spiral freezer diagram compared with a drum-driven design?
A: A self-stacking belt diagram shows no central drum — the centre of the plan view is open. Instead, detailed callouts appear on the belt inner edge, showing the precision bearing surface where each tier rests on the one below. A drum-driven diagram shows a large cylindrical element at the centre with belt wrap angle and friction surface annotations. The self-stacking design generally indicates a more hygienic configuration with fewer internal obstruction surfaces.
Keywords:
Inquiry
If you are interested in our products, please leave your email to receive a free product quote, thank you!
More information


Tel:
Sales E-mail: