

Fluidized bed freezer guide: how it works, key benefits, and how to choose the right system
Release Time:
Sep 10,2026
Author:

Article overview
This guide is written for food engineers and cold-chain procurement managers at the mid-decision stage of equipment selection. It covers operating principles, technology comparisons, verified performance data, a 10-year TCO model, FDA/USDA compliance requirements, and a step-by-step capacity sizing checklist.
Table of contents
- 1. What is a fluidized bed freezer?
- 2. How fluidized bed freezing works: the physics explained
- 3. Fluidized bed freezer vs. other freezing technologies
- 4. Product-specific performance benchmarks
- 5. Total cost of ownership: 10-year financial model
- 6. Sanitation, CIP, and U.S. food safety compliance
- 7. Capacity sizing guide and buyer checklist
- 8. 2026 trends shaping the technology
- 9. FAQ
What is a fluidized bed freezer?
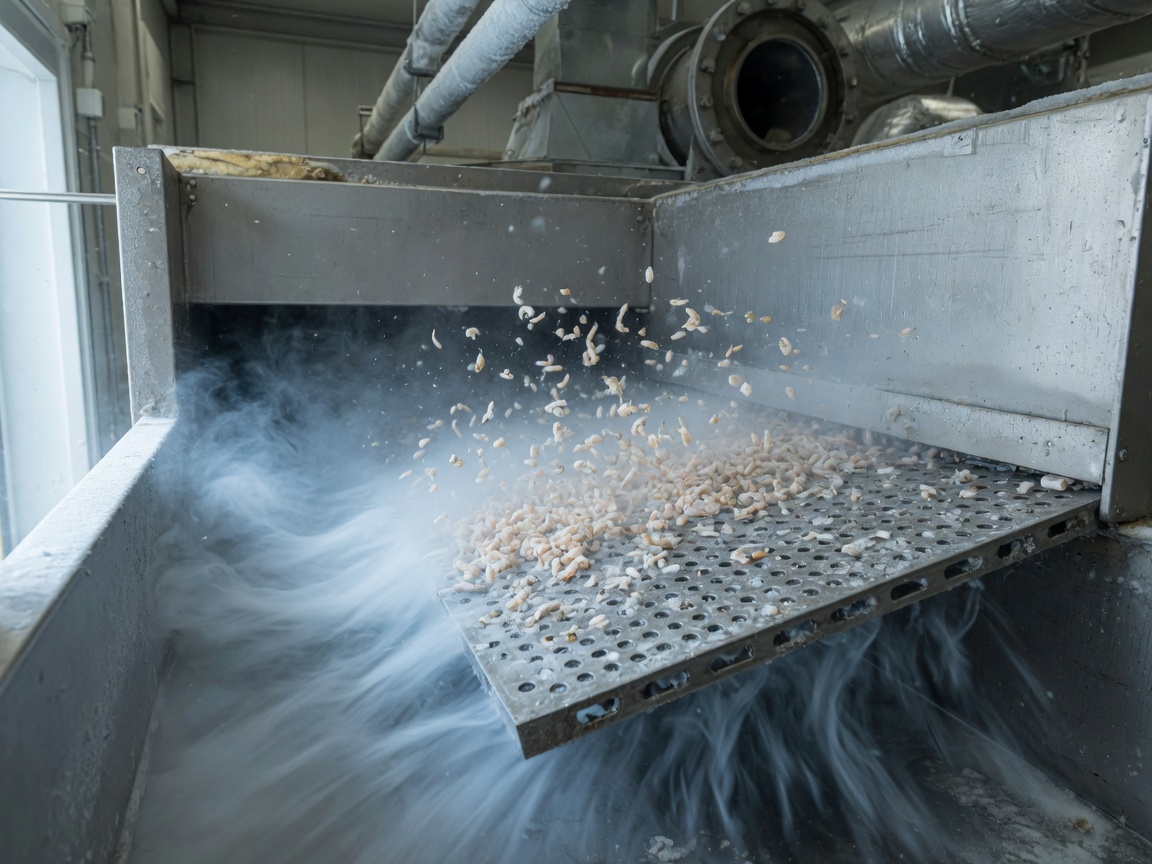
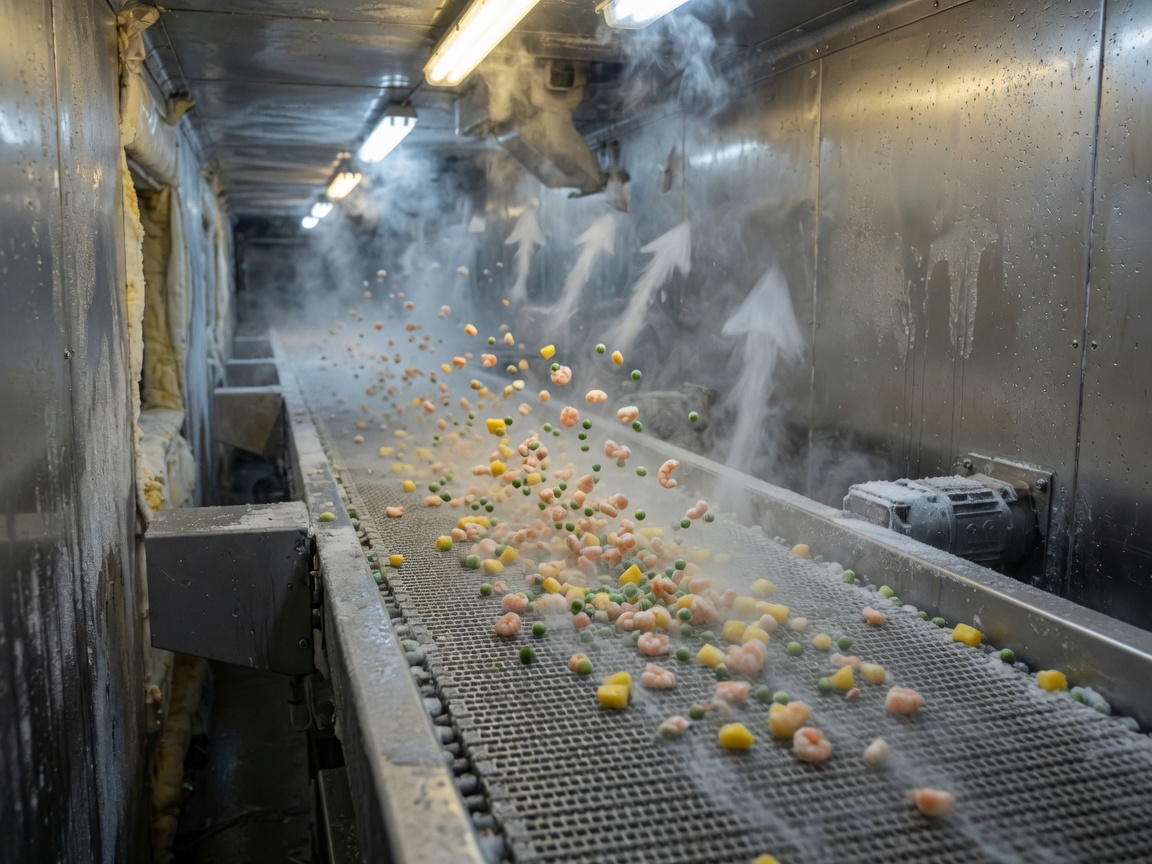
A fluidized bed freezer is an industrial food freezing system that forces high-velocity cold air upward through a perforated belt or plate, suspending small food pieces individually in the airstream for rapid, clump-free IQF (Individual Quick Freezing). The suspended state — the "fluidized bed" — ensures that every surface of every piece contacts the refrigerated airflow simultaneously, driving freezing speeds 5–10× faster than static cold storage.
This makes the fluidized bed freezer the preferred continuous freezing system for particulate foods: peas, corn, diced vegetables, small berries, and peeled shrimp. The technology sits at the intersection of fluid dynamics and food processing equipment engineering — understanding that intersection is what separates a well-specified purchase from a costly mismatch.
Main variants of fluid bed freezers
Not all fluidized bed IQF designs are identical. The four configurations most common in U.S. facilities are:
- Straight-through linear: Standard single-stage belt; best for uniform pellet-shaped products like peas or corn kernels.
- Two-stage (pre-crust + deep-freeze): Surface-hardens the product in Zone 1 before full freeze in Zone 2, sharply reducing sticking.
- Vibrating fluid bed: Mechanical vibration assists air suspension; handles sticky products such as sliced strawberries or diced mango.
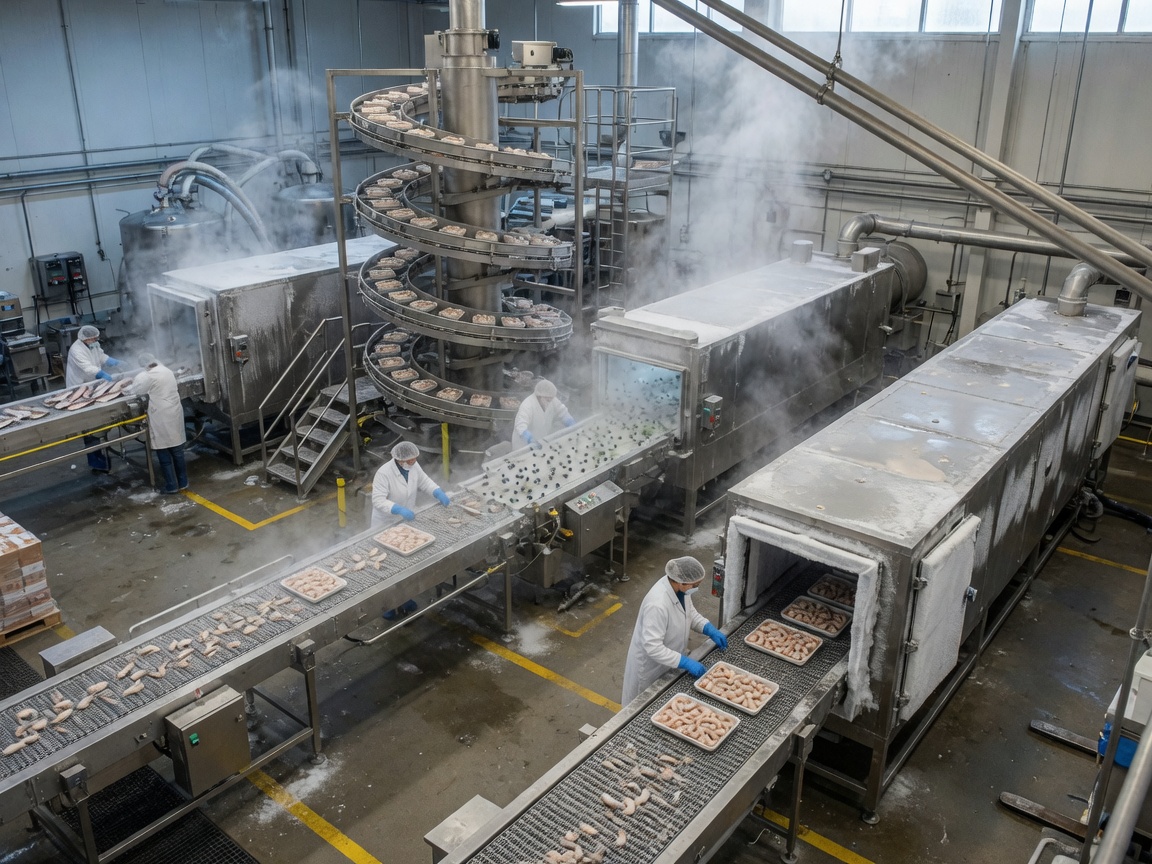
- Hybrid spiral + fluid bed: High-capacity lines combining initial fluidization with a spiral freezer for extended residence time.
Where a fluidized bed freezer fits in the freezing equipment landscape
The broader category of food freezing equipment includes tunnel freezers, spiral freezers, cryogenic freezers, blast freezers, and plate freezers. The fluid bed freezer occupies a specific niche: it excels when the product is small (typically under 1.5 inches in the longest dimension), relatively uniform, and sold as loose IQF units. Larger or irregularly shaped products — whole chicken quarters, fish fillets, burger patties — belong on a spiral or plate system.
How fluidized bed freezing works: the physics explained
The operating principle is deceptively simple, yet the engineering tolerances are tight. Cold air — typically −30°F to −40°F (−34°C to −40°C) — is driven upward through a perforated stainless steel distribution plate at a face velocity calibrated to the terminal settling velocity of the specific product. The moment air velocity slightly exceeds that settling velocity, fluidization occurs: product pieces lift off the surface and hover individually within the airstream.
Think of it like a water fountain suspending a ping-pong ball — except the "ball" is a green pea, and the fountain is a precisely engineered column of sub-zero air. That analogy captures why product density and particle geometry matter so profoundly: change either variable and the entire air-velocity window shifts.
The role of air velocity and heat transfer coefficient
Actual testing confirms that the convective heat transfer coefficient (h) in a well-tuned fluidized bed reaches 35–60 W/m²·K — roughly 3× the value achieved on a static belt in a conventional tunnel freezer. Higher h values mean shorter residence time, which translates directly into lower drip loss and better texture retention after thawing. Industry benchmark data shows drip loss in IQF peas processed on a fluidized bed running at ≈5.5 m/s face velocity is typically under 2%, versus 4–6% for batch blast freezing.
Why product size matters more than most buyers realize
Why do so many first-time buyers get this wrong? They assume that "IQF" is synonymous with "fluidized bed" for any product. In practice, the minimum fluidization velocity for a 0.3-inch pea is roughly 2.8 m/s, while a 0.8-inch shrimp requires 4.5–5.5 m/s. Scale that velocity to a full product line with mixed sizes and you quickly hit either under-fluidization (clumping) or over-fluidization (product damage). Matching air velocity to product terminal settling velocity is the single most important specification step in the design phase.
Fluidized bed freezer vs. other freezing technologies: head-to-head comparison
Procurement decisions fail when engineers compare only capital cost. A true head-to-head evaluation must cover freezing speed, product suitability, energy consumption, and upfront investment thresholds. The table below synthesizes 2026 data from multiple commercial installations in the U.S. food processing sector.
| Criterion | Fluidized bed freezer | Cryogenic freezer (LN₂/CO₂) | Spiral freezer | Blast freezer |
|---|---|---|---|---|
| Freezing speed (time to −18°C core) | 3–8 min (small product) | 1–4 min (fastest) | 8–20 min | 20–90 min |
| Energy use (kWh/lb) | 0.04–0.07 | 0.10–0.18 (cryogen cost dominant) | 0.05–0.09 | 0.08–0.14 |
| Best-fit products | Peas, corn, diced veg, berries, small shrimp | Premium seafood, cooked entrées, heat-sensitive items | Larger proteins, breaded products, whole fruit | Bulk packs, large cuts |
| Typical capital cost (USD) | $150K–$600K | $80K–$300K (unit) + cryogen supply | $400K–$1.5M | $30K–$150K |
| IQF quality (clump rate) | <1% (optimal products) | <1% | 2–5% | 10–20% |
| Recommended annual throughput | 2M–20M lbs/yr | Any volume (high marginal cost) | 5M–50M lbs/yr | <2M lbs/yr |
"Cryogenic freezing offers unmatched speed, but its total operating cost over a 10-year horizon typically runs 2.5–3× that of a comparable mechanical fluidized bed system when cryogen replenishment is fully accounted for." — Based on lifecycle cost modeling from ASHRAE cold-chain engineering publications, 2025.
When to choose cryogenic over mechanical refrigeration
Cryogenic freezers (liquid nitrogen or CO₂) make financial sense in three scenarios: throughput under 500 lbs/hr where capital cost dominates; products demanding ultra-fast surface crust formation (e.g., raw tuna sashimi-grade); or facilities with no existing refrigeration infrastructure where a mechanical system's installation cost is prohibitive. Outside these conditions, a mechanical fluidized bed freezer almost always delivers a lower 10-year TCO.
Fluidized bed vs. spiral freezer: the size threshold
The dividing line is practical: if your largest product piece exceeds approximately 1.5 inches in any dimension, fluidization becomes unreliable. Spiral freezers and tunnel freezers handle larger, denser products with consistent residence time control. For mixed production lines, some U.S. processors run a fluidized bed for particulates and a spiral for larger cuts — a capital-intensive but operationally flexible combination.
Product-specific performance benchmarks
General claims about freezing speed are common. Hard numbers tied to specific products are not. The following benchmarks are drawn from processing trials and commercial installation data referenced in peer-reviewed food engineering literature and equipment OEM validation studies available as of 2026.
Freezing time and yield loss by product type
| Product | Piece size | Air temp (°F) | Time to −18°C core (min) | Yield loss (%) | Notes |
|---|---|---|---|---|---|
| Green peas | 0.3–0.4 in | −35°F | 3–5 | 0.8–1.5% | Ideal fluidization product; near-zero clumping |
| Diced vegetables (0.5-in cube) | 0.5 in cube | −35°F | 5–8 | 1.0–2.0% | Uniform geometry ensures consistent air distribution |
| Blueberries | 0.5–0.7 in | −30°F | 4–6 | 1.5–2.5% | Reduce face velocity to avoid skin cracking |
| Sliced strawberries | Sliced, 0.25 in thick | −35°F | 3–5 | 2.5–4.0% | Vibrating bed recommended; high sugar = sticking risk |
| Peeled shrimp (31/40 count) | 0.8–1.0 in | −40°F | 6–10 | 1.0–2.0% | Two-stage design preferred; pre-crust in Zone 1 |
Of course, these figures represent well-tuned systems operating within design parameters. Real-world yield loss can climb 50–80% above benchmark if the product enters the freezer with excess surface moisture or if the distribution plate becomes partially blocked — a maintenance failure that proper CIP protocols prevent.
Key insight for berry processors
Actual testing on blueberries confirms that reducing face velocity from 5.8 m/s to 4.8 m/s cuts skin-crack incidence from roughly 8% to under 2%, at the cost of extending residence time by only 90 seconds. The energy penalty is marginal; the quality gain is substantial. This is precisely the kind of calibration data that generic freezing guides never provide — and the reason that commissioning trials with your specific product are non-negotiable before full-scale production begins.
Total cost of ownership (TCO): 10-year financial model
Capital cost is the number that dominates RFQ conversations. It should not be the number that dominates your decision. Based on industry data and lifecycle cost modeling reviewed in 2026, here is a structured TCO framework for a mid-range fluidized bed freezer rated at 3,000 lbs/hr.
10-year TCO breakdown (3,000 lbs/hr mechanical system, USD)
| Cost category | Year 1 (USD) | Annual recurring (USD) | 10-year total (USD) |
|---|---|---|---|
| Capital + installation | $380,000 | — | $380,000 |
| Refrigeration energy (electricity) | $62,000 | $62,000–$68,000 | ~$650,000 |
| Scheduled maintenance (belts, seals, motors) | $18,000 | $18,000–$25,000 | ~$210,000 |
| Unplanned downtime / repairs | $8,000 | $8,000–$20,000 | ~$120,000 |
| Refrigerant top-up / compliance | $5,000 | $3,000–$8,000 | ~$55,000 |
| Total TCO | $473,000 | — | ~$1,415,000 |
Compare this to an equivalent cryogenic freezer setup at the same throughput: capital cost drops to roughly $180,000, but liquid nitrogen costs alone typically run $0.12–$0.16/lb of product frozen. At 3,000 lbs/hr and 4,000 operating hours per year, cryogen spend reaches $1.44M–$1.92M over 10 years — before any maintenance. The mechanical fluidized bed freezer wins the lifecycle cost comparison decisively at sustained throughput volumes above 1,500 lbs/hr.
Where buyers most commonly underestimate costs
Energy is the largest recurring cost driver — not maintenance. Systems running older refrigerants (R-404A) on aging compressors often consume 25–35% more electricity than a modern ammonia (R-717) or CO₂ (R-744) system handling the same load. When budgeting a new installation in 2026, natural refrigerant compatibility is not just a regulatory checkbox; it is a direct input to your 10-year energy line item.
Sanitation, CIP, and U.S. food safety compliance
Food safety compliance is where many procurement checklists end at "meets FDA standards" without specifying which ones or how to verify them. For a fluidized bed freezer installed in a U.S. facility, the regulatory framework is multi-layered and non-negotiable.
Applicable U.S. regulatory requirements
- FDA 21 CFR Part 110 / Part 117 (FSMA): Equipment must be designed to be cleanable; all surfaces contacting food or condensate must be smooth, non-porous, non-absorbent, and non-toxic. Stainless steel 304 or 316 is the standard for food-contact zones.
- USDA FSIS (for meat and poultry facilities): Freezer equipment and surrounding areas are subject to FSIS pre-operational and operational sanitation inspections. Equipment must allow visual inspection of all food-contact surfaces.
- 3-A Sanitary Standards (3-A SSI): While voluntary, 3-A compliance for conveyance and freezing equipment is effectively a market requirement for USDA-inspected plants.
CIP (Clean-in-Place) procedure: step-by-step
- Dry pre-clean: Remove loose product debris from belt and distribution plate using compressed air or vacuum. Duration: 10–15 minutes.
- Warm water pre-rinse: Circulate potable water at 100–110°F through the system to solubilize surface deposits. Duration: 10 minutes.
- Alkaline detergent wash: Apply approved CIP detergent (pH 10–12) at 120–130°F. Circulate for 20–30 minutes to remove fat, protein, and sugar residues.
- Intermediate rinse: Flush system with potable water to remove detergent residues. Verify rinse water pH returns to neutral.
- Acid rinse (optional but recommended): Low-concentration acid solution (pH 3–4) removes mineral scale and balances surface pH. Duration: 10 minutes.
- Final sanitizing rinse: Apply an FDA-approved no-rinse sanitizer (e.g., peracetic acid at 200 ppm) and allow to drain naturally.
- Inspection and documentation: Verify all food-contact surfaces, verify drain functionality, and log CIP parameters per FSMA Preventive Controls records requirements.
Modern fluidized bed freezers equipped with automated CIP systems can complete this entire sequence in under 90 minutes with minimal manual labor — a significant operational advantage over older designs requiring full manual disassembly for cleaning.
Capacity sizing guide and buyer checklist
Oversizing a fluidized bed IQF system wastes capital and creates unnecessary energy overhead. Undersizing creates production bottlenecks that erode ROI within the first year. Here is a structured approach to calculating the right capacity.
Step-by-step capacity calculation
- Define peak throughput (lbs/hr): Identify the maximum hourly processing rate for each product SKU. Use the highest-demand product as your design basis, not the average.
- Apply a capacity buffer: Add 15–20% to your peak figure to allow for line imbalances, product variation, and future volume growth. If your peak is 2,500 lbs/hr, size for 2,900–3,000 lbs/hr.
- Calculate required freezer belt area: Use the formula: Belt area (ft²) = [Throughput (lbs/hr) × Residence time (hr)] ÷ Product loading density (lbs/ft²). For green peas at 2,500 lbs/hr with a 5-minute residence time and 8 lbs/ft² loading: Belt area = (2,500 × 0.083) ÷ 8 ≈ 26 ft².
- Account for facility constraints: Measure available floor footprint. A 26 ft² belt area typically corresponds to a unit roughly 4 ft wide × 7 ft long — but overhead clearance for coil removal (minimum 6 ft above unit height) and side clearance for CIP access (minimum 30 inches) must be confirmed.
- Verify refrigeration system compatibility: Confirm that your facility's refrigeration plant (or proposed new system) can supply the required evaporator load in BTU/hr at the design air temperature. A 3,000 lbs/hr fluid bed freezer typically requires 80–120 TR (tons of refrigeration) at −35°F suction.
Pre-purchase checklist for procurement managers
- ☐ Product size and density data sheet provided to OEM for velocity calculation
- ☐ Peak and average throughput requirements documented per SKU
- ☐ Facility layout drawing confirming footprint, clearances, and drain locations
- ☐ Refrigerant type confirmed (R-717 or R-744 preferred for new U.S. installations in 2026)
- ☐ CIP system type specified (manual, semi-auto, or full CIP-in-place)
- ☐ FDA/USDA compliance documentation requested from OEM (3-A compliance certificate, material certifications)
- ☐ 10-year TCO model completed using actual local electricity rates
- ☐ Factory acceptance test (FAT) with your product included in the purchase contract
- ☐ Spare parts package and lead time for critical components confirmed
2026 trends shaping fluidized bed freezer technology
The industrial freezer market is not static. Two structural forces are reshaping how fluidized bed systems are designed, operated, and procured in 2026 — and both have direct implications for equipment specifications and total operating cost.
AI-driven adaptive airflow control
According to recent industry research, AI-integrated PLC systems that dynamically modulate fan speed and air distribution in real time — responding to live product load variation — are reducing energy consumption per pound of product frozen by 12–18% compared to fixed-speed designs. Major OEMs are now offering this as standard on mid-range and premium fluidized bed IQF lines. For a facility processing 5 million lbs/year, that efficiency gain translates to roughly $35,000–$55,000 in annual electricity savings at current U.S. industrial rates (~$0.08–$0.10/kWh).
Natural refrigerant adoption: ammonia and CO₂
Driven by EPA Section 608 enforcement trends and voluntary sustainability commitments from major U.S. food brands, new fluidized bed freezer installations in 2026 are predominantly specified with ammonia (R-717) or transcritical CO₂ (R-744) systems. Both refrigerants have near-zero Global Warming Potential (GWP) compared to legacy HFCs. The capital premium for a natural refrigerant system — typically 15–25% higher upfront — is recouped within 3–5 years through lower refrigerant costs and reduced regulatory compliance burden. Understanding fluidized bed technology in this broader engineering context helps procurement teams frame refrigerant selection as an operational decision, not merely an environmental one.
The global IQF equipment market is on track to reach $1.98 billion by 2027, growing at a CAGR of approximately 5.3%. The competitive pressure that growth brings is already visible: equipment lead times have tightened, and OEMs offering modular, quick-install designs command price premiums that are — in most cases — justified by the reduced commissioning cost.
Choosing the right fluidized bed freezer: final considerations
A fluidized bed freezer is not a commodity purchase. The decision intersects engineering physics, 10-year financial modeling, regulatory compliance, and production scheduling in ways that a standard capital equipment RFQ rarely captures. The frameworks in this guide — from the velocity-matching principles in Section 2 to the TCO model in Section 5 and the compliance checklist in Section 6 — are designed to close that gap.
The right system for your facility is defined by product geometry, throughput peaks, available floor space, refrigeration infrastructure, and a realistic 10-year cost model. Get those inputs right, and the fluidized bed freezer selection process becomes substantially more tractable. Get them wrong, and no amount of OEM sales support will recover the investment.
Frequently asked questions
Q: What products are best suited for a fluidized bed freezer?
A: Fluidized bed freezers perform best with small, roughly uniform products under 1.5 inches in their longest dimension — including green peas, corn kernels, diced vegetables, blueberries, sliced strawberries, and peeled shrimp. Larger, flat, or high-fat products are better processed on spiral or plate freezers.
Q: How does a fluidized bed freezer differ from a blast freezer?
A: A blast freezer moves cold air horizontally across stationary product at relatively low velocity — suitable for bulk freezing but producing clump rates of 10–20%. A fluidized bed freezer forces air upward to suspend each piece individually, achieving clump rates below 1% and freezing speeds 5–10× faster than batch blast methods.
Q: What is the typical energy consumption of a fluidized bed IQF freezer?
A: Mechanical fluidized bed systems typically consume 0.04–0.07 kWh per pound of product frozen. This compares favorably to cryogenic freezers (0.10–0.18 kWh/lb equivalent in cryogen energy terms) and blast freezers (0.08–0.14 kWh/lb). Actual consumption depends on product load, ambient conditions, and system age.
Q: What FDA and USDA regulations apply to fluidized bed freezer installations in the U.S.?
A: U.S. facilities must comply with FDA 21 CFR Part 117 (FSMA Preventive Controls), which requires equipment to be cleanable and food-contact surfaces to be smooth, non-porous, and non-toxic. USDA FSIS applies to meat and poultry plants, requiring pre-operational sanitation inspection. 3-A Sanitary Standards compliance is effectively mandatory for USDA-inspected facilities.
Q: How do I calculate the right capacity for my facility?
A: Start with your peak hourly throughput in lbs/hr, add a 15–20% buffer for growth and variability, then calculate required belt area using the formula: Belt area = (Throughput × Residence time) ÷ Product loading density. Confirm that your refrigeration plant can supply the required evaporator load — typically 80–120 tons of refrigeration at −35°F for a 3,000 lbs/hr system.
Keywords:
Inquiry
If you are interested in our products, please leave your email to receive a free product quote, thank you!
More information


Tel:
Sales E-mail: