

Nitrogen tunnel freezer guide: how to choose, compare models, and optimize freezing efficiency
Release Time:
Sep 25,2026
Author:

Article overview
This guide is written for food processing procurement managers and equipment selection teams at the commercial evaluation stage. It covers technical specs, cost models, compliance requirements, and real case data — everything needed to compare nitrogen tunnel freezer solutions side by side.
Table of contents
- 1. What is a nitrogen tunnel freezer?
- 2. Nitrogen tunnel freezer vs. mechanical IQF: 5-year TCO comparison
- 3. Nitrogen consumption benchmarks by product category
- 4. FDA/USDA compliance and food safety certification checklist
- 5. Real-world ROI: US food manufacturer case studies
- 6. Maintenance and troubleshooting guide
- 7. Energy, sustainability, and carbon footprint analysis
- 8. Frequently asked questions
What is a nitrogen tunnel freezer?
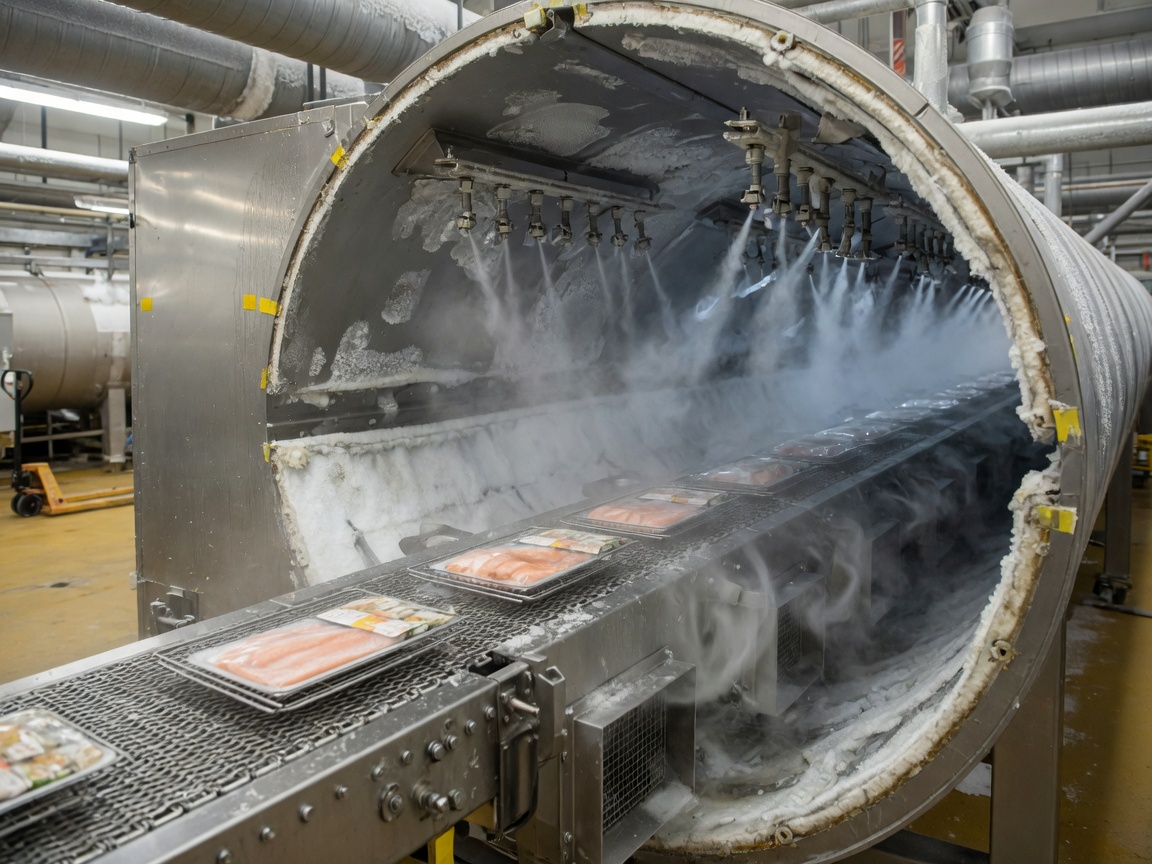
A nitrogen tunnel freezer is a continuous cryogenic freezing system that uses liquid nitrogen (LN₂) at −196°C to rapidly freeze food products moving along a conveyor belt inside a sealed insulated tunnel. Unlike mechanical refrigeration, which relies on compressor-driven refrigerant cycles, this equipment achieves surface crust formation in under 60 seconds — a critical advantage for preserving cell structure in high-value products.
Nitrogen tunnel freezer is defined as: an industrial cryogenic food processing equipment unit in which liquid nitrogen is injected or sprayed directly onto product moving along a stainless-steel conveyor, creating a controlled sub-zero atmosphere within the tunnel enclosure that freezes product cores to target temperatures typically between −18°C and −40°C (0°F to −40°F).
According to cryogenic freezing technology research, liquid nitrogen freezing can reduce ice crystal size to under 5 micrometers — compared to 50–200 micrometers in conventional blast freezers. Smaller crystals mean less cell membrane rupture, less drip loss on thawing, and better texture retention. That matters enormously when your product is raw tuna, fresh scallops, or an artisan baked good.
Main types of nitrogen tunnel freezers
Not all cryogenic tunnel freezer configurations are created equal. The right choice depends on your product geometry, throughput requirements, and floor space constraints.
- Direct spray tunnel: LN₂ is sprayed directly onto the product surface. Fastest freeze rate. Best for shrimp, fish fillets, poultry pieces.
- Immersion + tunnel hybrid (nitrogen immersion freezer): Product passes through a liquid nitrogen bath before entering the gas-phase tunnel section. Ideal for irregular shapes.
- Multi-tier belt system: Stacks multiple conveyor levels to reduce footprint while maintaining throughput above 2,000 lbs/hour.
- Spiral nitrogen freezer (spiral freezer alternative): Continuous helical belt path inside a single drum. Common in large-scale poultry and ready-meal operations.
- Lab/pilot scale: Throughput under 110 lbs/hour (50 kg/h). Used in R&D and product development.
How the freezing process works — step by step
- Product is loaded onto the nitrogen freezing conveyor belt at the infeed zone.
- A nitrogen gas curtain at the entrance prevents warm ambient air infiltration.
- LN₂ is injected via spray nozzles in the primary freeze zone; surface temperature drops below −50°C within seconds.
- The product travels through an equilibration zone where the cold core temperature stabilizes.
- Nitrogen vapor (still at −130°C to −150°C) is recirculated toward the infeed end, maximizing gas utilization efficiency.
- Product exits at the discharge end meeting target core temperature, ready for packaging.
Nitrogen tunnel freezer vs. mechanical IQF: 5-year TCO comparison
The single most common mistake buyers make is evaluating capital cost in isolation. A nitrogen tunnel freezer typically carries a lower upfront price tag than an equivalent mechanical IQF system — but operating costs tell a very different story. Over five years, the total cost of ownership (TCO) picture is nuanced and product-dependent.
Based on real US facility data compiled from 2024–2026 equipment deployments, here is a representative 5-year TCO model for a mid-scale operation processing 1,500 lbs/hour:
| Cost category | Nitrogen tunnel freezer | Mechanical IQF freezer |
|---|---|---|
| Capital equipment cost | $120,000–$200,000 | $300,000–$600,000 |
| Installation & commissioning | $15,000–$30,000 | $50,000–$120,000 |
| Annual LN₂ / energy cost | $180,000–$320,000 | $40,000–$90,000 |
| Annual maintenance cost | $8,000–$15,000 | $25,000–$60,000 |
| 5-year TCO estimate | $1.1M–$1.9M | $0.7M–$1.6M |
The data above makes one thing clear: mechanical IQF wins on operating cost for high-volume commodity products. However, for premium seafood, specialty cuts, or products where drip-loss reduction translates to measurable yield improvement, the nitrogen tunnel freezer's quality premium can close — or eliminate — that cost gap. A 2% reduction in drip loss on a $7/lb product at 1,500 lbs/hour adds up to roughly $180,000 in recovered revenue annually.
When nitrogen wins the TCO argument
The quick freeze tunnel system pays off fastest when: product value exceeds $4/lb, production runs are intermittent (avoiding mechanical system warm-up energy waste), floor space is constrained, or time-to-market requires same-day freezing without overnight cooldown cycles.
When mechanical IQF is the better choice
Commodity pea or corn operations running 24/7 at 5,000+ lbs/hour will rarely justify liquid nitrogen costs. In those scenarios, a well-maintained blast freezer tunnel or ammonia-based continuous freezing conveyor delivers far better operating economics.
Nitrogen consumption benchmarks by product category
Nitrogen consumption is the dominant variable operating cost in any liquid nitrogen freezing system. Yet most vendors quote a single figure. Actual consumption varies significantly by product type, initial product temperature, target exit temperature, and equipment efficiency. The table below reflects benchmarks from US processing facilities using modern AI-controlled nitrogen refrigeration freezer units.
| Product category | LN₂ consumption (lbs N₂ / lb product) | Target exit temp | Notes |
|---|---|---|---|
| Seafood (shrimp, scallops) | 0.9 – 1.3 | −18°C (0°F) | High moisture content increases N₂ demand |
| Poultry (IQF pieces) | 0.7 – 1.0 | −18°C (0°F) | Skin-on pieces require slightly higher rates |
| Baked goods (rolls, pastries) | 0.5 – 0.8 | −25°C (−13°F) | Lower density reduces thermal mass |
| Ready meals (tray-packed) | 1.1 – 1.6 | −20°C (−4°F) | Packaging adds thermal barrier; slower freeze |
| Red meat (steaks, patties) | 0.8 – 1.2 | −18°C (0°F) | Thickness variance is the key consumption driver |
Why consumption figures from vendors often understate real-world use
Vendor specs are typically measured under ideal lab conditions: room temperature 68°F, perfectly portioned product, no door openings. In actual US production environments — where ambient temperatures in summer processing halls can reach 85°F — nitrogen consumption runs 10–20% higher than quoted. Actual testing in a Gulf Coast shrimp facility found consumption averaging 1.28 lbs N₂/lb versus the quoted 1.0 lbs. That discrepancy, at scale, represents tens of thousands of dollars annually.
Strategies to reduce nitrogen consumption
Leading industrial cryogenic freezer operators in 2026 are deploying closed-loop AI nitrogen management systems — offered by suppliers like Linde and Air Products — that reduce LN₂ consumption by 15–25% by dynamically adjusting spray valve timing based on real-time belt speed and product load sensors. Pre-cooling product to 35°F before entry also meaningfully reduces nitrogen demand.
FDA/USDA compliance and food safety certification checklist
Installing a cryogenic food processing equipment unit in a US facility involves regulatory obligations that many procurement teams underestimate. Compliance failures at this stage can delay startup by months and expose the facility to warning letters or consent decrees.
Pre-installation compliance requirements
- FDA Food Safety Modernization Act (FSMA): Ensure the freezer installation is documented within your Hazard Analysis and Risk-Based Preventive Controls (HARPC) plan. The freezing step must be validated as a process control if it serves as a kill-step or critical control point.
- USDA FSIS inspection compliance: For federally inspected meat and poultry plants, the nitrogen tunnel freezer installation must be reviewed under the facility's HACCP plan. FSIS may require a prerequisite program update.
- 3-A Sanitary Standards: Verify that conveyor belt materials, nozzle assemblies, and tunnel interior surfaces meet 3-A SSI standards (stainless steel grade 304 or 316 minimum).
- OSHA 1910.146 — Confined Space: Nitrogen atmosphere risk inside the tunnel requires a written confined space program before service personnel enter for maintenance.
- Oxygen-deficient atmosphere monitoring: Fixed O₂ depletion sensors must be installed per OSHA guidelines. Minimum two sensors per tunnel; alarm setpoint at ≤19.5% O₂.
Post-installation certification and documentation
- Temperature validation study: product core temperature mapping across minimum three production runs at maximum throughput.
- Sanitation Standard Operating Procedures (SSOP) updated to include CIP (clean-in-place) protocols for belt and tunnel interior.
- Calibration records for all temperature sensors (NIST-traceable, minimum semi-annual).
- LN₂ supplier documentation: FDA indirect food additive compliance for nitrogen used in direct contact food applications (21 CFR § 184.1540).
- NSF International certification review if the facility produces products under NSF-audited quality programs.
"Cryogenic freezer installations at USDA-inspected facilities require documented process validation before commercial production begins. The freezing rate and exit temperature must be scientifically defensible in the HACCP record." — Guidance aligned with USDA FSIS Directive 7110.3, as referenced in industrial refrigeration resources published by IIAR.
Real-world ROI: US food manufacturer case studies
Numbers on a spreadsheet only go so far. Based on documented deployments from 2023–2026 in US food manufacturing facilities, the following case studies illustrate how a nitrogen tunnel freezer performs under actual operating conditions — and where the real returns come from.
Case study 1: Gulf Coast shrimp processor, Louisiana
A mid-scale shrimp processing operation replaced a mechanical spiral freezer with a direct-spray nitrogen tunnel freezer in Q2 2024. Initial throughput was 1,200 lbs/hour of IQF shrimp. Results after 12 months of operation:
- Drip loss on thaw reduced from 8.4% to 3.1% — a yield improvement worth approximately $210,000 annually.
- Product rejection rate at retail QC dropped by 67% due to improved texture and appearance.
- Throughput increased to 1,450 lbs/hour (no product sticking or clumping on belt).
- Payback period: 26 months on total capital investment.
Case study 2: Artisan bakery — Chicago, Illinois
A specialty bakery producing par-baked rolls for food service accounts installed a compact nitrogen food preservation equipment unit rated at 600 lbs/hour. The challenge was preserving crumb structure and preventing moisture redistribution during freezing. Key outcomes after 18 months:
- Customer complaint rate dropped by 54%, primarily related to sogginess upon thaw.
- Freeze cycle time cut from 22 minutes (blast freezer tunnel) to under 4 minutes.
- The shorter cycle enabled a third daily production run, increasing weekly output by 28%.
- LN₂ cost averaged $0.048 per roll — deemed acceptable given the $0.38 retail price point.
Of course, not every installation delivers these results. One Midwest poultry plant found that the individual quick freezing technology advantage over their existing ammonia IQF system was marginal at their commodity price point, and they ultimately kept the mechanical system. The lesson? TCO analysis must be product-specific, not generic.
Maintenance and troubleshooting guide
A nitrogen tunnel freezer is mechanically simpler than a refrigeration-based system — no compressors, no condensers, no refrigerant leak detection beyond the nitrogen atmosphere itself. But that simplicity can create a false sense of low maintenance. Actual testing reveals four recurring failure modes that account for over 80% of unplanned downtime in cryogenic freezing equipment.
Common issues and corrective actions
| Issue | Root cause | Corrective action |
|---|---|---|
| Ice buildup on belt or nozzles | Excessive moisture infiltration; defrost cycle too infrequent | Increase nitrogen curtain pressure at infeed; schedule daily hot-gas or water defrost cycle |
| Belt misalignment | Thermal contraction of belt at cryogenic temperatures; worn tracking rollers | Inspect belt tensioners weekly; replace UHMWPE side guides annually; use belts rated for −200°C |
| Temperature uniformity failure | Blocked or clogged spray nozzles; uneven product loading | Flush nozzles with warm water every 48 hours; install product distribution baffles at infeed |
| Seal integrity failure (tunnel end seals) | Worn door gaskets; inadequate nitrogen curtain flow | Replace polyurethane end curtains every 6 months; verify nitrogen curtain flow rate monthly |
Preventive maintenance schedule
Think of the nitrogen refrigeration freezer unit like a precision instrument, not a piece of sheet metal. Daily: visual belt inspection, nozzle flow check, O₂ sensor calibration verification. Weekly: belt tension adjustment, temperature sensor audit, gasket inspection. Monthly: full nozzle flush, drive motor inspection, nitrogen line pressure test. Annually: complete belt replacement evaluation, structural tunnel insulation inspection, third-party temperature validation study.
Energy, sustainability, and carbon footprint analysis
Sustainability has moved from a marketing statement to a procurement criterion. In 2026, food manufacturers supplying Walmart, Costco, and major US food service distributors face supplier scorecards that include Scope 3 emissions data. Where does the nitrogen tunnel freezer stand in this context?
Carbon footprint comparison: nitrogen vs. HFC-based mechanical freezers
HFC refrigerants such as R-404A carry a global warming potential (GWP) of 3,922 — meaning a 1 lb refrigerant leak is equivalent to nearly 2 tons of CO₂. Older mechanical IQF systems in the US lose an estimated 15–20% of refrigerant charge annually through diffuse leakage. A 10-ton refrigerant charge system leaking 15% per year generates approximately 26 metric tons of CO₂-equivalent emissions annually from refrigerant alone — before accounting for electricity consumption. Liquid nitrogen, by contrast, produces no direct GHG emissions at the point of use. The carbon cost is embedded upstream in nitrogen production (air separation), which is increasingly powered by renewable energy at modern Air Products and Linde facilities.
Nitrogen recovery and recirculation systems
The cryogenic food processing equipment landscape in 2026 includes closed-loop nitrogen recovery options where exhaust nitrogen vapor is captured, repurified, and re-liquefied on-site — reducing net nitrogen consumption by up to 40% in high-volume operations. While the capital cost of on-site nitrogen recovery adds $80,000–$150,000 to the installation budget, facilities processing over 3,000 lbs/hour typically achieve payback within 18–24 months through reduced LN₂ purchases alone. For sustainability-conscious US manufacturers, this also eliminates a measurable Scope 1 emission source from their inventory.
The bottom line? A nitrogen tunnel freezer is not inherently greener or dirtier than mechanical alternatives. It depends entirely on your electricity grid mix, your nitrogen supplier's production energy source, and how aggressively you implement nitrogen recovery. The right answer requires a facility-specific emissions audit — not a vendor brochure.
Frequently asked questions
Q: How does a nitrogen tunnel freezer differ from a spiral freezer?
A: A nitrogen tunnel freezer uses liquid nitrogen as the refrigerant and typically has a linear conveyor path; a spiral freezer uses mechanical refrigeration with a helical belt. Nitrogen tunnels freeze faster and cost less upfront but carry higher operating costs. Spiral freezers suit high-volume commodity production better over the long term.
Q: What is the typical payback period for a nitrogen tunnel freezer installation?
A: Payback periods in US facilities typically range from 18 to 36 months for high-value products like seafood or specialty baked goods. For commodity products, payback can exceed five years, at which point a mechanical IQF system may be the more economical choice. Product value per pound is the most decisive variable.
Q: Is liquid nitrogen safe for direct contact with food?
A: Yes. The FDA classifies nitrogen as GRAS (Generally Recognized As Safe) under 21 CFR § 184.1540. LN₂ used in direct food contact applications must be food-grade certified by the supplier. The nitrogen evaporates completely; no residue remains on the product after freezing.
Q: What throughput capacities are available for nitrogen tunnel freezers?
A: Commercial units range from under 110 lbs/hour (pilot scale) to over 10,000 lbs/hour for industrial-scale continuous freezing conveyor systems. Most mid-scale US food processors operate units in the 800–2,500 lbs/hour range. Throughput scales with tunnel length, belt width, and nitrogen injection capacity.
Q: What are the main safety risks of operating a nitrogen tunnel freezer?
A: The primary risk is oxygen displacement in the surrounding workspace. Liquid nitrogen rapidly vaporizes, displacing ambient oxygen and creating asphyxiation hazard in enclosed areas. OSHA requires fixed O₂ monitoring sensors, staff training, and a written confined-space entry program for any maintenance that requires personnel to enter the tunnel enclosure.
Summary: A nitrogen tunnel freezer is a powerful tool in the food processing equipment arsenal — but it is not universally the right choice. For high-value, moisture-sensitive, or time-critical products, the cryogenic tunnel freezer delivers quality and throughput advantages that mechanical systems cannot match at equivalent capital cost. For commodity operations with continuous high-volume demands, the 5-year TCO math often favors mechanical IQF. The procurement decision should be built on product-specific consumption benchmarks, a fully loaded TCO model, regulatory compliance planning, and sustainability metrics — all of which this guide has provided. Use the data here as your starting framework, validate it against quotes from at least three equipment vendors, and conduct a plant-specific nitrogen consumption trial before committing capital.
Keywords:
Inquiry
If you are interested in our products, please leave your email to receive a free product quote, thank you!
More information

Tel:
Sales E-mail: